Clearer forecasts for U.S. energy traders
Redesigned the most widely used weather insights platform in the U.S. energy trading sector, turning complex forecasts into clear, actionable information for faster and more confident decision-making.
This project is under NDA

About the project
Goal
As lead designer, I was responsible for co-facilitating user interviews, synthesizing research findings to define a UX vision, defining the UX architecture, driving the ideation of new solution concepts, producing high-resolution designs and documentation, and conducting design QA to ensure the quality of the implemented app.
Client
This client is one of the most used weather forecast applications among energy traders in the US. Traders have it open on a monitor all day long to track how the evolution of weather forecasts might impact their positions.
Role
User research
Conceptual design
High-resolution design
Dataviz design
Date
Mar - Jul 2022
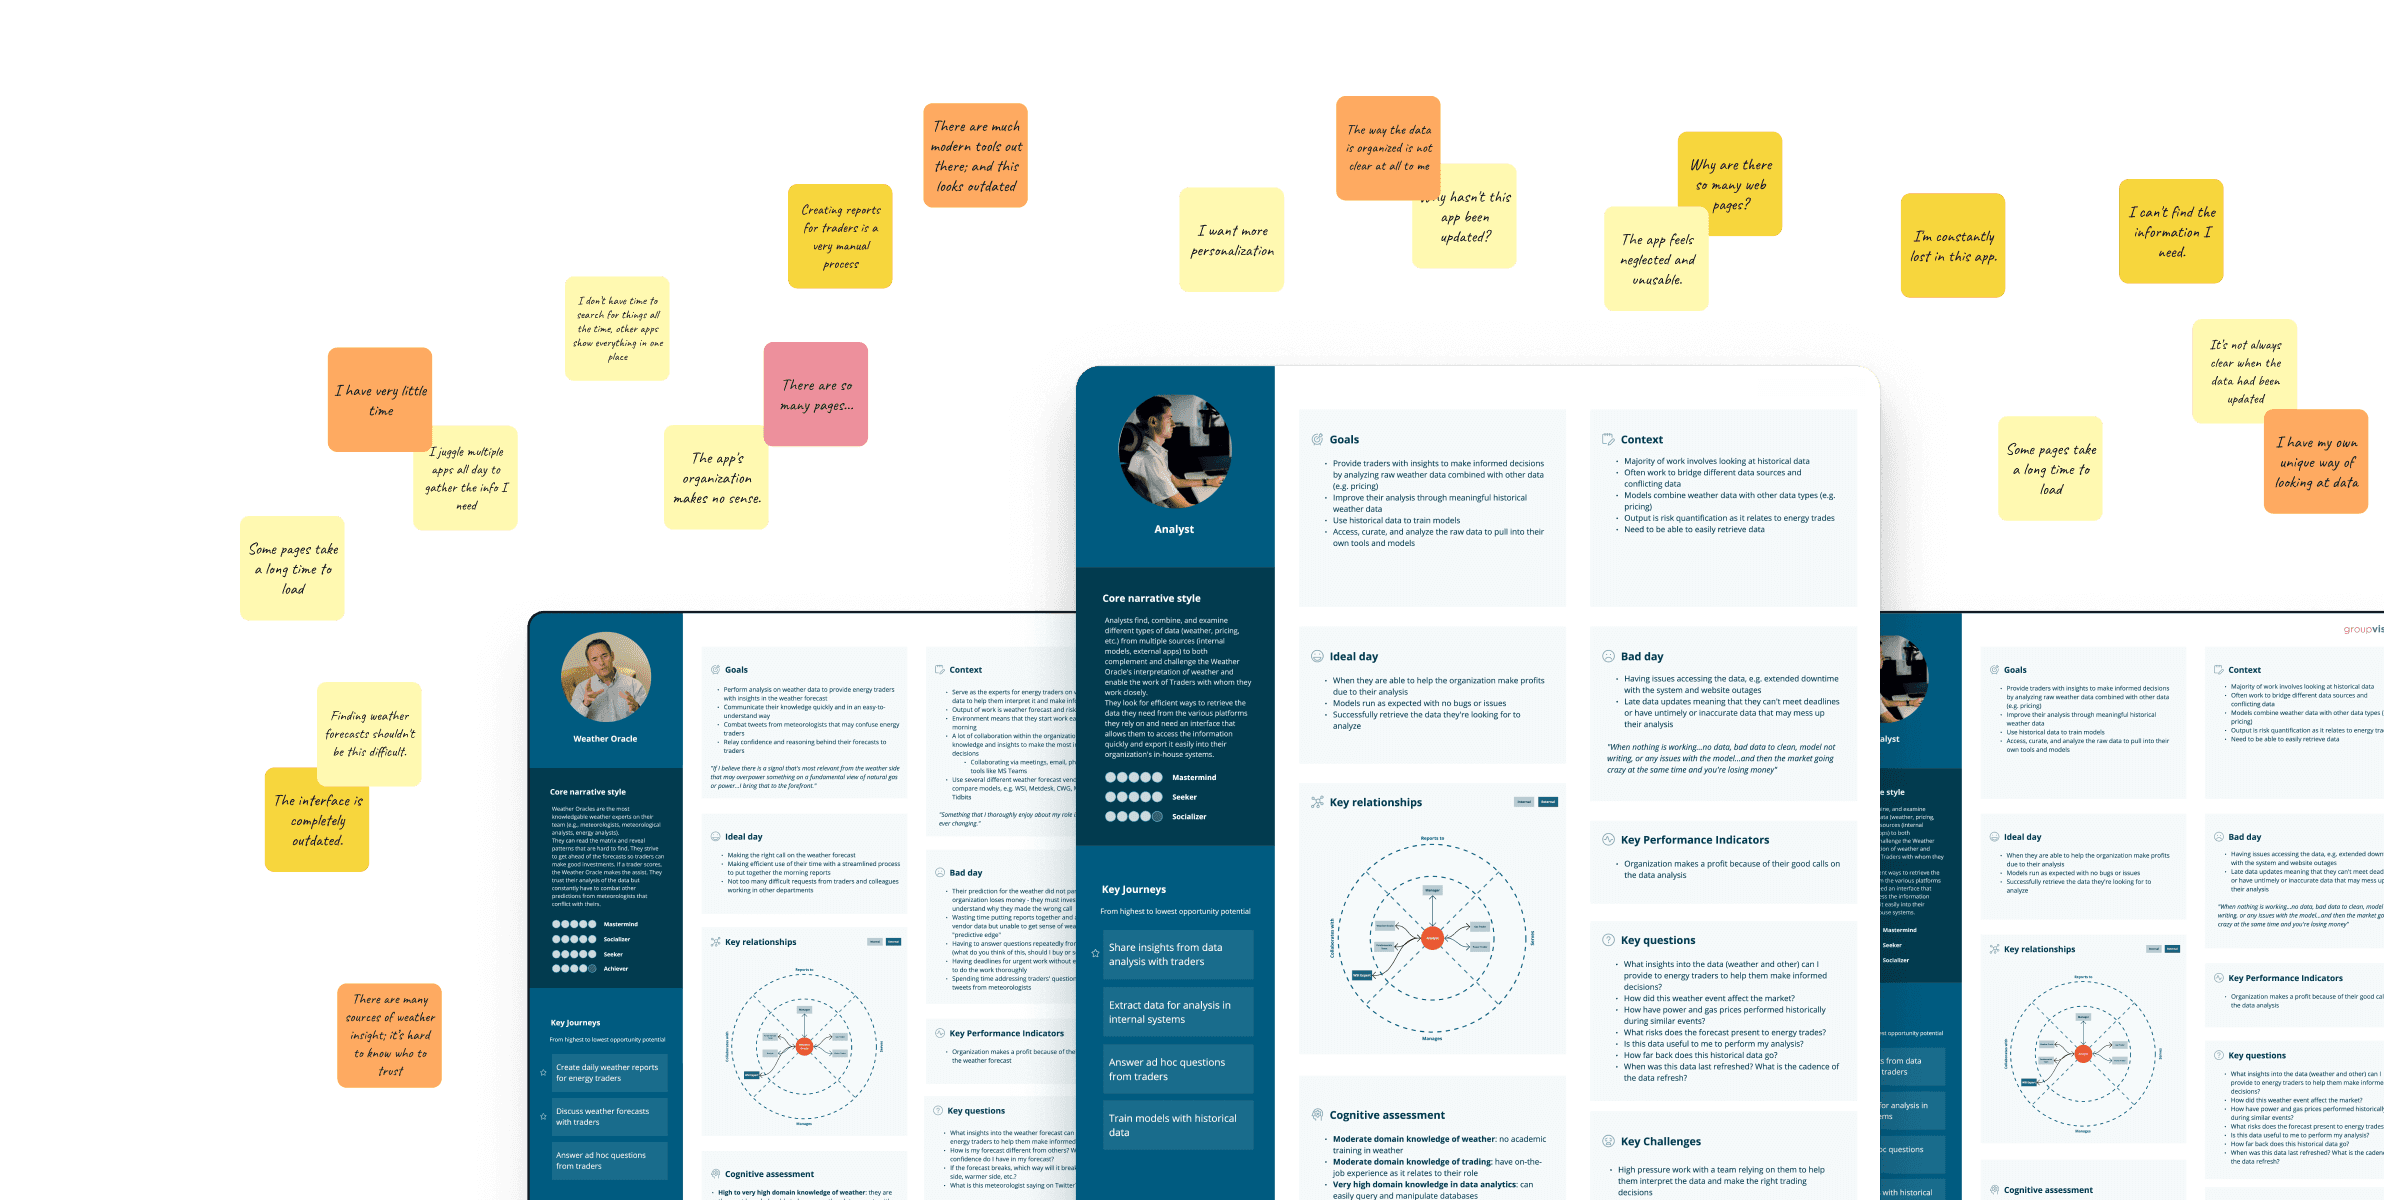
Phase 1
Research
Through user interviews, we identified two key persona: energy or gas traders racing to spot weather patterns that would allow them to strengthen their positions and generate gains, and weather experts responsible for translating complex weather data into actionable insight for traders. Synthesizing their feedback, we found that: users found the product’s mental model unclear, the experience didn’t feel personalized to their specific needs, the amount of data was overwhelming and didn’t help them focus, and users struggle to interpret the visualizations in the product.
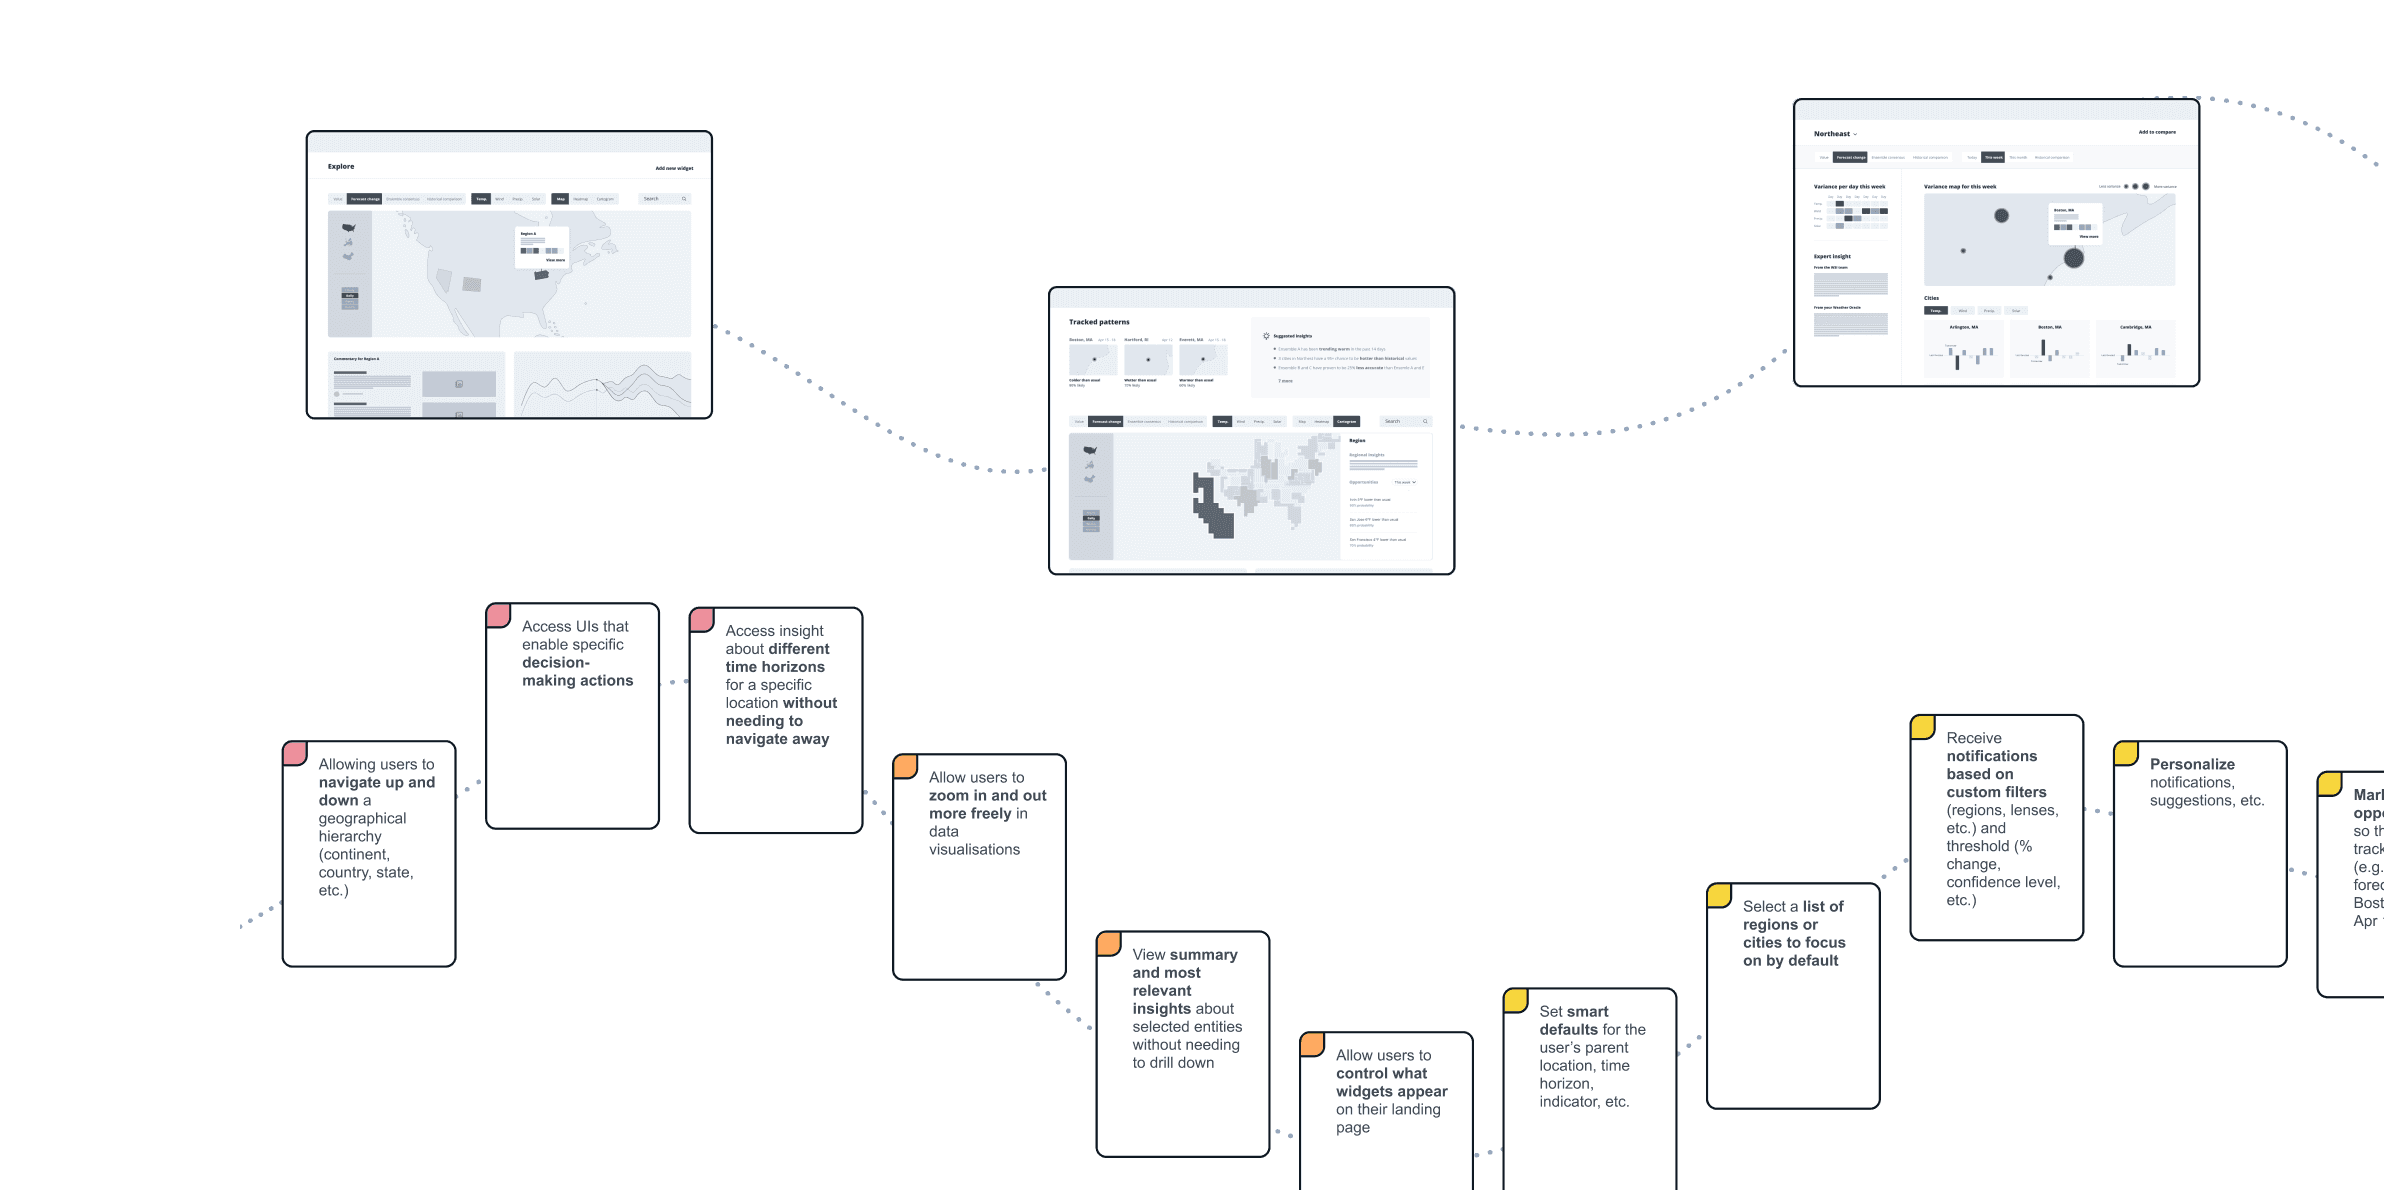
Phase 2
Ideation and definition
I then led the ideation phase to identify solutions that would allow users to leverage intuitive mental models (space, time), enjoy a much more personalised experience, focus their attention more quickly on what matters the most to them, and interpret the data more easily.
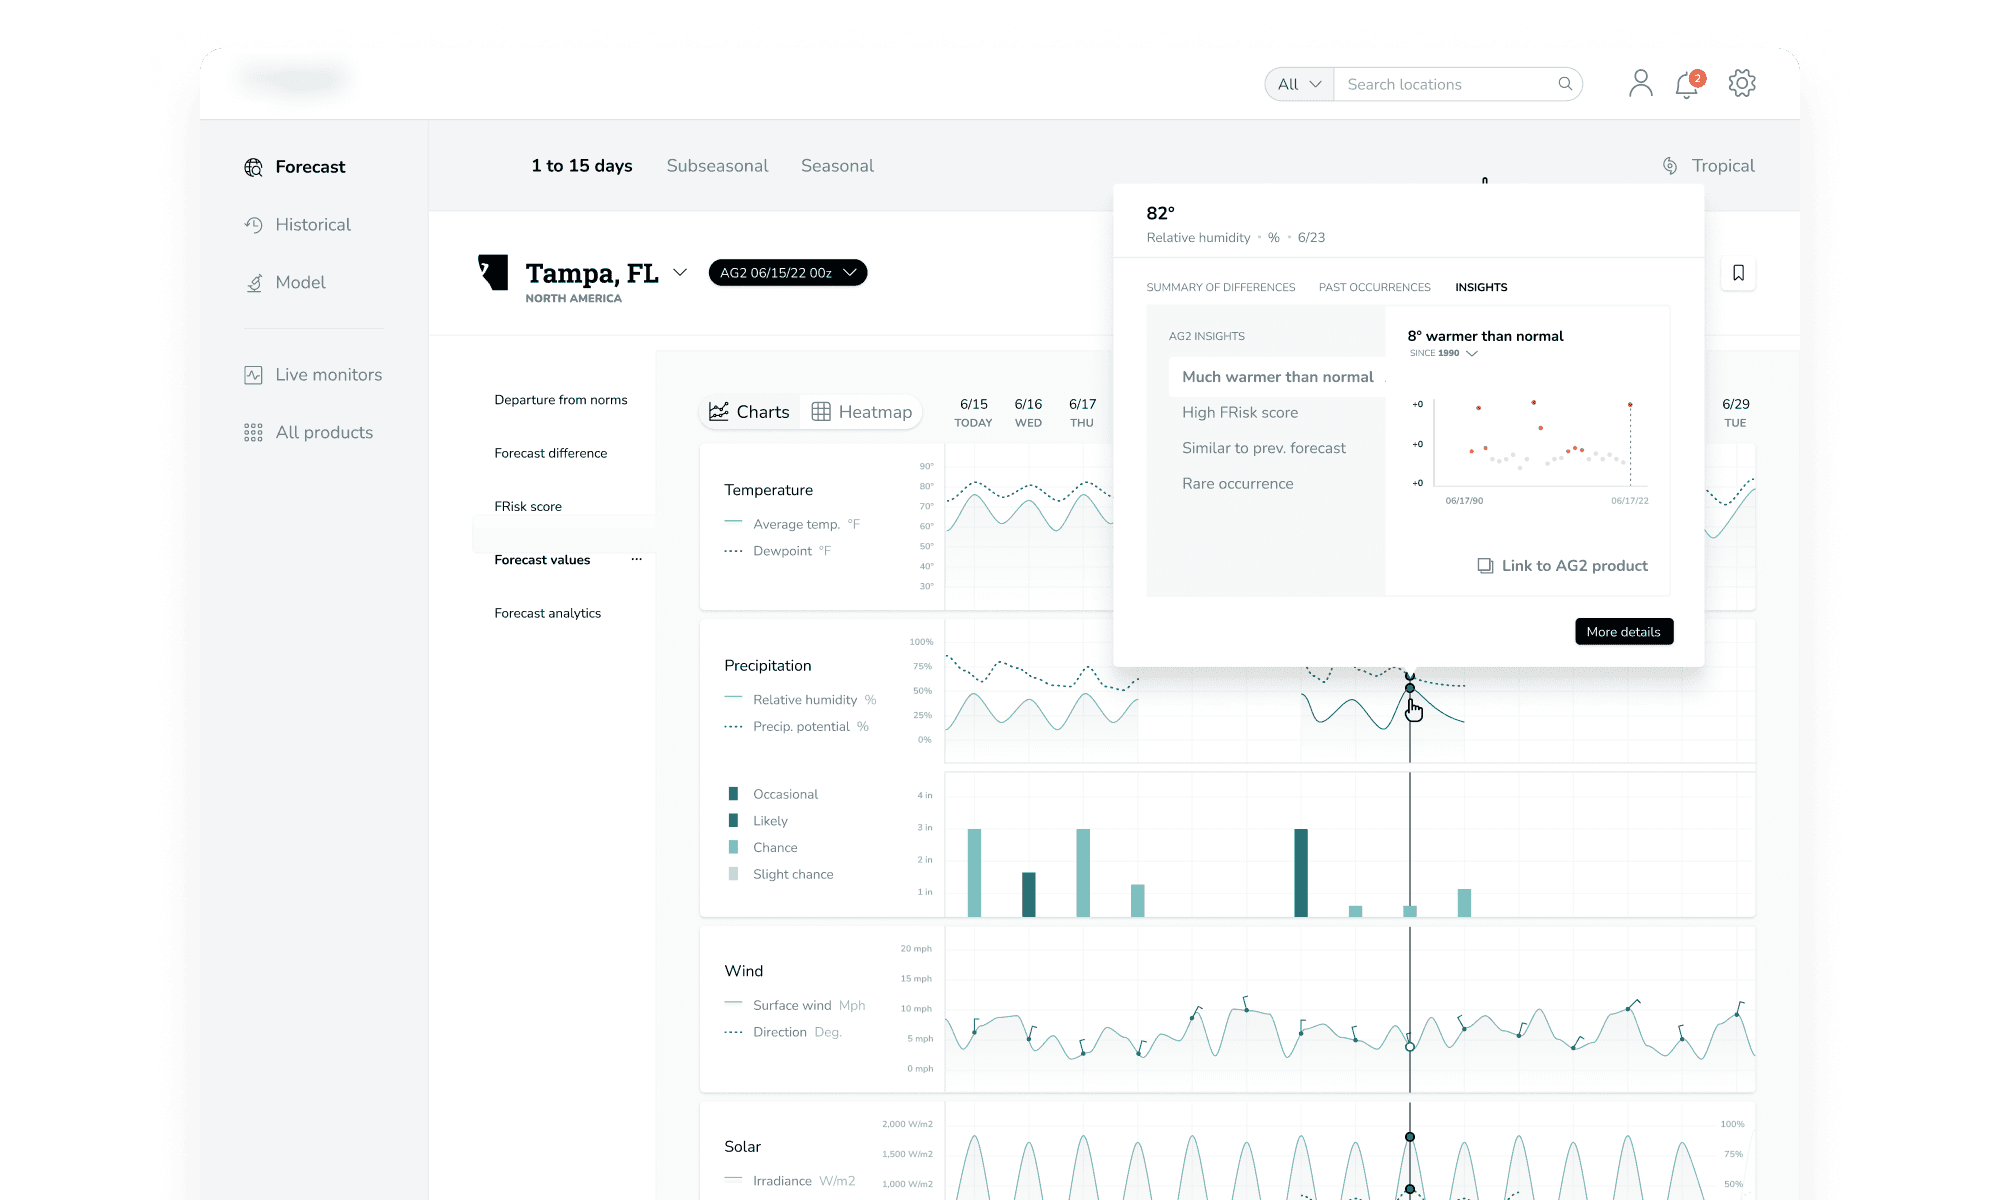

Takeaways
Takeaway 1
First, it was an opportunity to entirely rethink a complex application used by 90% of energy traders in the United States; high impact.
Takeaway 2
Additionally, it meant some stakeholders hesitated to change patterns their clients had been using the same way for nearly 10 years. Several rounds of user testing allowed us to show proof of the need for change and the value of the new ideas we suggested.
Takeaway 3
Finally, customers felt the experience wasn’t personalized enough. For years, these clients had requested the ability to build and manage custom dashboards, so several stakeholders were hell-bent on prioritizing this feature above all else. However, our research showed it would introduce much complexity for most users; only a small subset of advanced users would benefit. Defending our propositions using user testing data was key while also seeing how to fit the client’s more complex idea into an overall approach: light, in-line personalization for most and fully customizable dashboards for some.

You have a project in mind?
Don’t hesitate to get in touch. I'm curious to learn about the challenges you and your users are facing, and discuss how we could work together to solve them.
You have a project in mind?
Don’t hesitate to get in touch. I'm curious to learn about the challenges you and your users are facing, and discuss how we could work together to solve them.
You have a project in mind?
Clearer forecasts for U.S. energy traders
Redesigned the most widely used weather insights platform in the U.S. energy trading sector, turning complex forecasts into clear, actionable information for faster and more confident decision-making.
This project is under NDA